Outcomes Data

The Cardiothoracic Surgery Program at Nationwide Children’s Hospital is dedicated to treating all patients, from fetus to adult. We help patients with congenital heart defects - from the most straightforward cases to the extremely complex.
We provide this information publicly by reporting our volumes and outcomes data each year. In doing so, we hope to give patients and families the information they need to choose the right health care partner for their child’s journey.
- Volume data is the number of procedures a hospital has performed and can be a good indication of experience.
- Outcomes data uses several factors to evaluate the success of a hospital’s clinical practices.
We hope this information provides you with full transparency on our cardiac program.
Surgical Outcomes
Congenital heart surgeons perform more than 200 different procedures on fewer than 1 million patients each year in the United States. This makes comparing survival outcomes difficult.
The Heart Center at Nationwide Children’s participates in public reporting through the Society of Thoracic Surgeons (STS). The STS groups different types of pediatric cardiothoracic surgeries and procedures based on complexity, called STAT categories, with 1 the lowest complexity and 5 the highest complexity.
STAT Level 1 procedures are the least complex. STAT Level 5 procedures are the most complex.
Our expert surgeons are known for their treatment of complex, high-risk patients. By comparing data from previous years, we can track annual improvement in program quality and patient outcomes.
The average surgical mortality among pediatric heart programs is around 2.8%, with most centers between 2.5% and 4%. The Heart Center at Nationwide Children’s has been committed to improving outcomes and, through various targeted initiatives, has successfully lowered surgical mortality.
Cardiothoracic Surgical Survival Rates by STAT Category of Complexity
(STAT Category 1-5: Level 1, least complex; Level 5, most complex)
| 2024 | 2023 | 2022 | 2021 | 2020 | |||||||||||
|---|---|---|---|---|---|---|---|---|---|---|---|---|---|---|---|
| Deaths | Cases | Mortality Rate | Deaths | Cases | Mortality Rate | Deaths | Cases | Mortality Rate |
Deaths | Cases | Mortality Rate | Deaths | Cases | Mortality Rate | |
| STAT Level 1 | 0 | 143 | 0.00% |
2 |
151 | 1.32% | 2 | 142 | 1.4% | 0 | 146 | 0.00% | 1 | 146 | 0.68% |
| STAT Level 2 | 2 | 82 | 2.44% | 1 | 54 | 1.85% | 0 | 67 | 0.00% | 0 | 64 | 0.00% | 0 | 57 | 0.00% |
| STAT Level 3 | 0 | 32 | 0.00% | 2 | 48 | 4.17% | 0 | 37 | 0.00% | 1 | 47 | 2.13% | 2 | 30 |
6.67% |
| STAT Level 4 | 2 | 41 | 4.88% | 1 | 31 | 3.23% | 6 | 42 | 14.29% | 2 | 28 | 7.14% | 1 | 26 | 3.85% |
| STAT Level 5 | 4 | 16 | 25.00% | 5 | 17 | 29.41% | 2 | 12 | 16.67% | 3 | 10 | 30.00% | 1 | 13 | 7.69% |
| Total | 8 | 314 | 2.55% | 11 | 301 | 3.65% | 10 | 300 | 3.33% | 6 | 295 | 2.03% | 5 | 272 | 1.84% |
Volume Data
Several metrics are used to monitor the growth and quality of surgical programs:
- Case mix describes the types of cases seen in the program.
- Volume describes how many patients are seen in different populations.
By sharing these data for Cardiothoracic Surgery and Interventional Cardiology, we offer families an objective measure of our experience with certain types of cases and ages of patients.
| Highlighted Case Mix of Interventional Cardiology Procedures |
|||||
|---|---|---|---|---|---|
| 2024 | 2023 | 2022 | 2021 | 2020 | |
| ASD Closure | 16 | 22 | 13 | 26 | 20 |
| PDA Closure | 31 | 36 | 39 | 45 | 47 |
| Transcatheter heart valve | 23 | 12 | 15 | 19 | 21 |
| Balloon pulmonary valvuloplasty | 20 | 19 | 17 | 6 | 19 |
| Balloon aortic valvuloplasty | 2 | 4 | 4 | 3 | 5 |
| Pulmonary artery angioplasty | 79 | 66 | 68 | 100 | 108 |
| Pulmonary artery stent | 62 | 45 | 33 | 41 | 46 |
| Aortic angioplasty | 18 | 24 | 20 | 30 | 40 |
| Aortic stent | 20 | 25 | 19 | 19 | 15 |
| Cardiothoracic Surgical Volume |
|||||
|---|---|---|---|---|---|
| 2024 | 2023 | 2022 | 2021 | 2020 | |
| Adult | 45 | 59 | 41 | 63 | 46 |
| Child | 209 | 235 | 193 | 184 | 158 |
| Infant | 115 | 136 | 136 | 127 | 133 |
| Neonate | 60 | 75 | 64 | 67 | 73 |
| Total | 429 | 505 | 434 | 441 | 410 |
| Highlighted Case Mix of Cardiothoracic Surgical Procedures |
|||||
|---|---|---|---|---|---|
| 2024 | 2023 | 2022 | 2021 | 2020 | |
| VSD repair | 16 | 21 | 37 | 33 | 20 |
| TOF repair (included TOF/AVC repair) | 12 | 13 | 15 | 7 | 13 |
| AVSD repair | 23 | 9 | 7 | 14 | 10 |
| Arterial Switch | 10 | 8 | 4 | 7 | 8 |
| Arterial Switch + VSD repair | 2 | 6 | 2 | 4 | 1 |
| Glenn | 6 | 5 | 9 | 8 | 5 |
| Fontan | 9 | 15 | 10 | 20 | 17 |
| Truncus | 2 | 1 | 5 | 3 | 4 |
| Norwood | 0 | 2 | 1 | 1 | 3 |
| Coarctation repair (no CPB) | 4 | 0 | 4 | 9 | 12 |
| Hybrid Stage 1 | 14 | 9 | 10 | 9 | 8 |
| Comprehensive Stage 2 | 9 | 8 | 3 | 4 | 7 |
| Diagnostic Catheterizations |
|||||
|---|---|---|---|---|---|
| 2024 | 2023 | 2022 | 2021 | 2020 | |
| Adult | 54 | 65 | 66 | 65 | 57 |
| Child | 98 | 100 | 96 | 122 | 59 |
| Infant | 24 | 35 | 23 | 20 | 38 |
| Newborn | 6 | 12 | 4 | 6 | 6 |
| Interventional Catheterizations |
|||||
|---|---|---|---|---|---|
| 2024 | 2023 | 2022 | 2021 | 2020 | |
| Adult | 51 | 62 | 39 | 46 | 42 |
| Child | 165 | 164 | 142 | 174 | 141 |
| Infant | 68 | 77 | 81 | 73 | 89 |
| Newborn | 47 | 39 | 38 | 32 | 29 |
The Heart Center at Nationwide Children’s is a high-volume, comprehensive center focused on delivering best outcomes to children living with congenital heart conditions. From our fetal interventions to our adult congenital heart disease clinics, we are here to provide a lifetime of care. The table below shows our volumes for specialty services other than surgery and interventional cardiology.
| Specialty Services | 2024 | 2023 | 2022 | 2021 | 2020 |
| Electrophysiology Procedures | 166 | 186 | 183 | 172 | 138 |
| Hospital Patient Days | 10,618 | 11,186 | 11,245 | 9,446 | 7,312 |
| Noninvasive Diagnostics | 40,896 | 39,647 | 38,401 | 39,858 | 32,892 |
| — Echocardiogram | 17,305 | 16,441 | 16,021 | 16,654 | 14,049 |
| — Other Noninvasive Tests | 23,591 | 23,206 | 22,380 | 23,204 | 18,843 |
| Adult Congenital Heart Disease Outpatient Visits | 2,459 | 2,426 | 2,696 | 2,571 | 2,021 |
| Pediatric Cardiology Outpatient Visits | 22,585 | 22,258 | 21,090 | 19,732 | 16,568 |
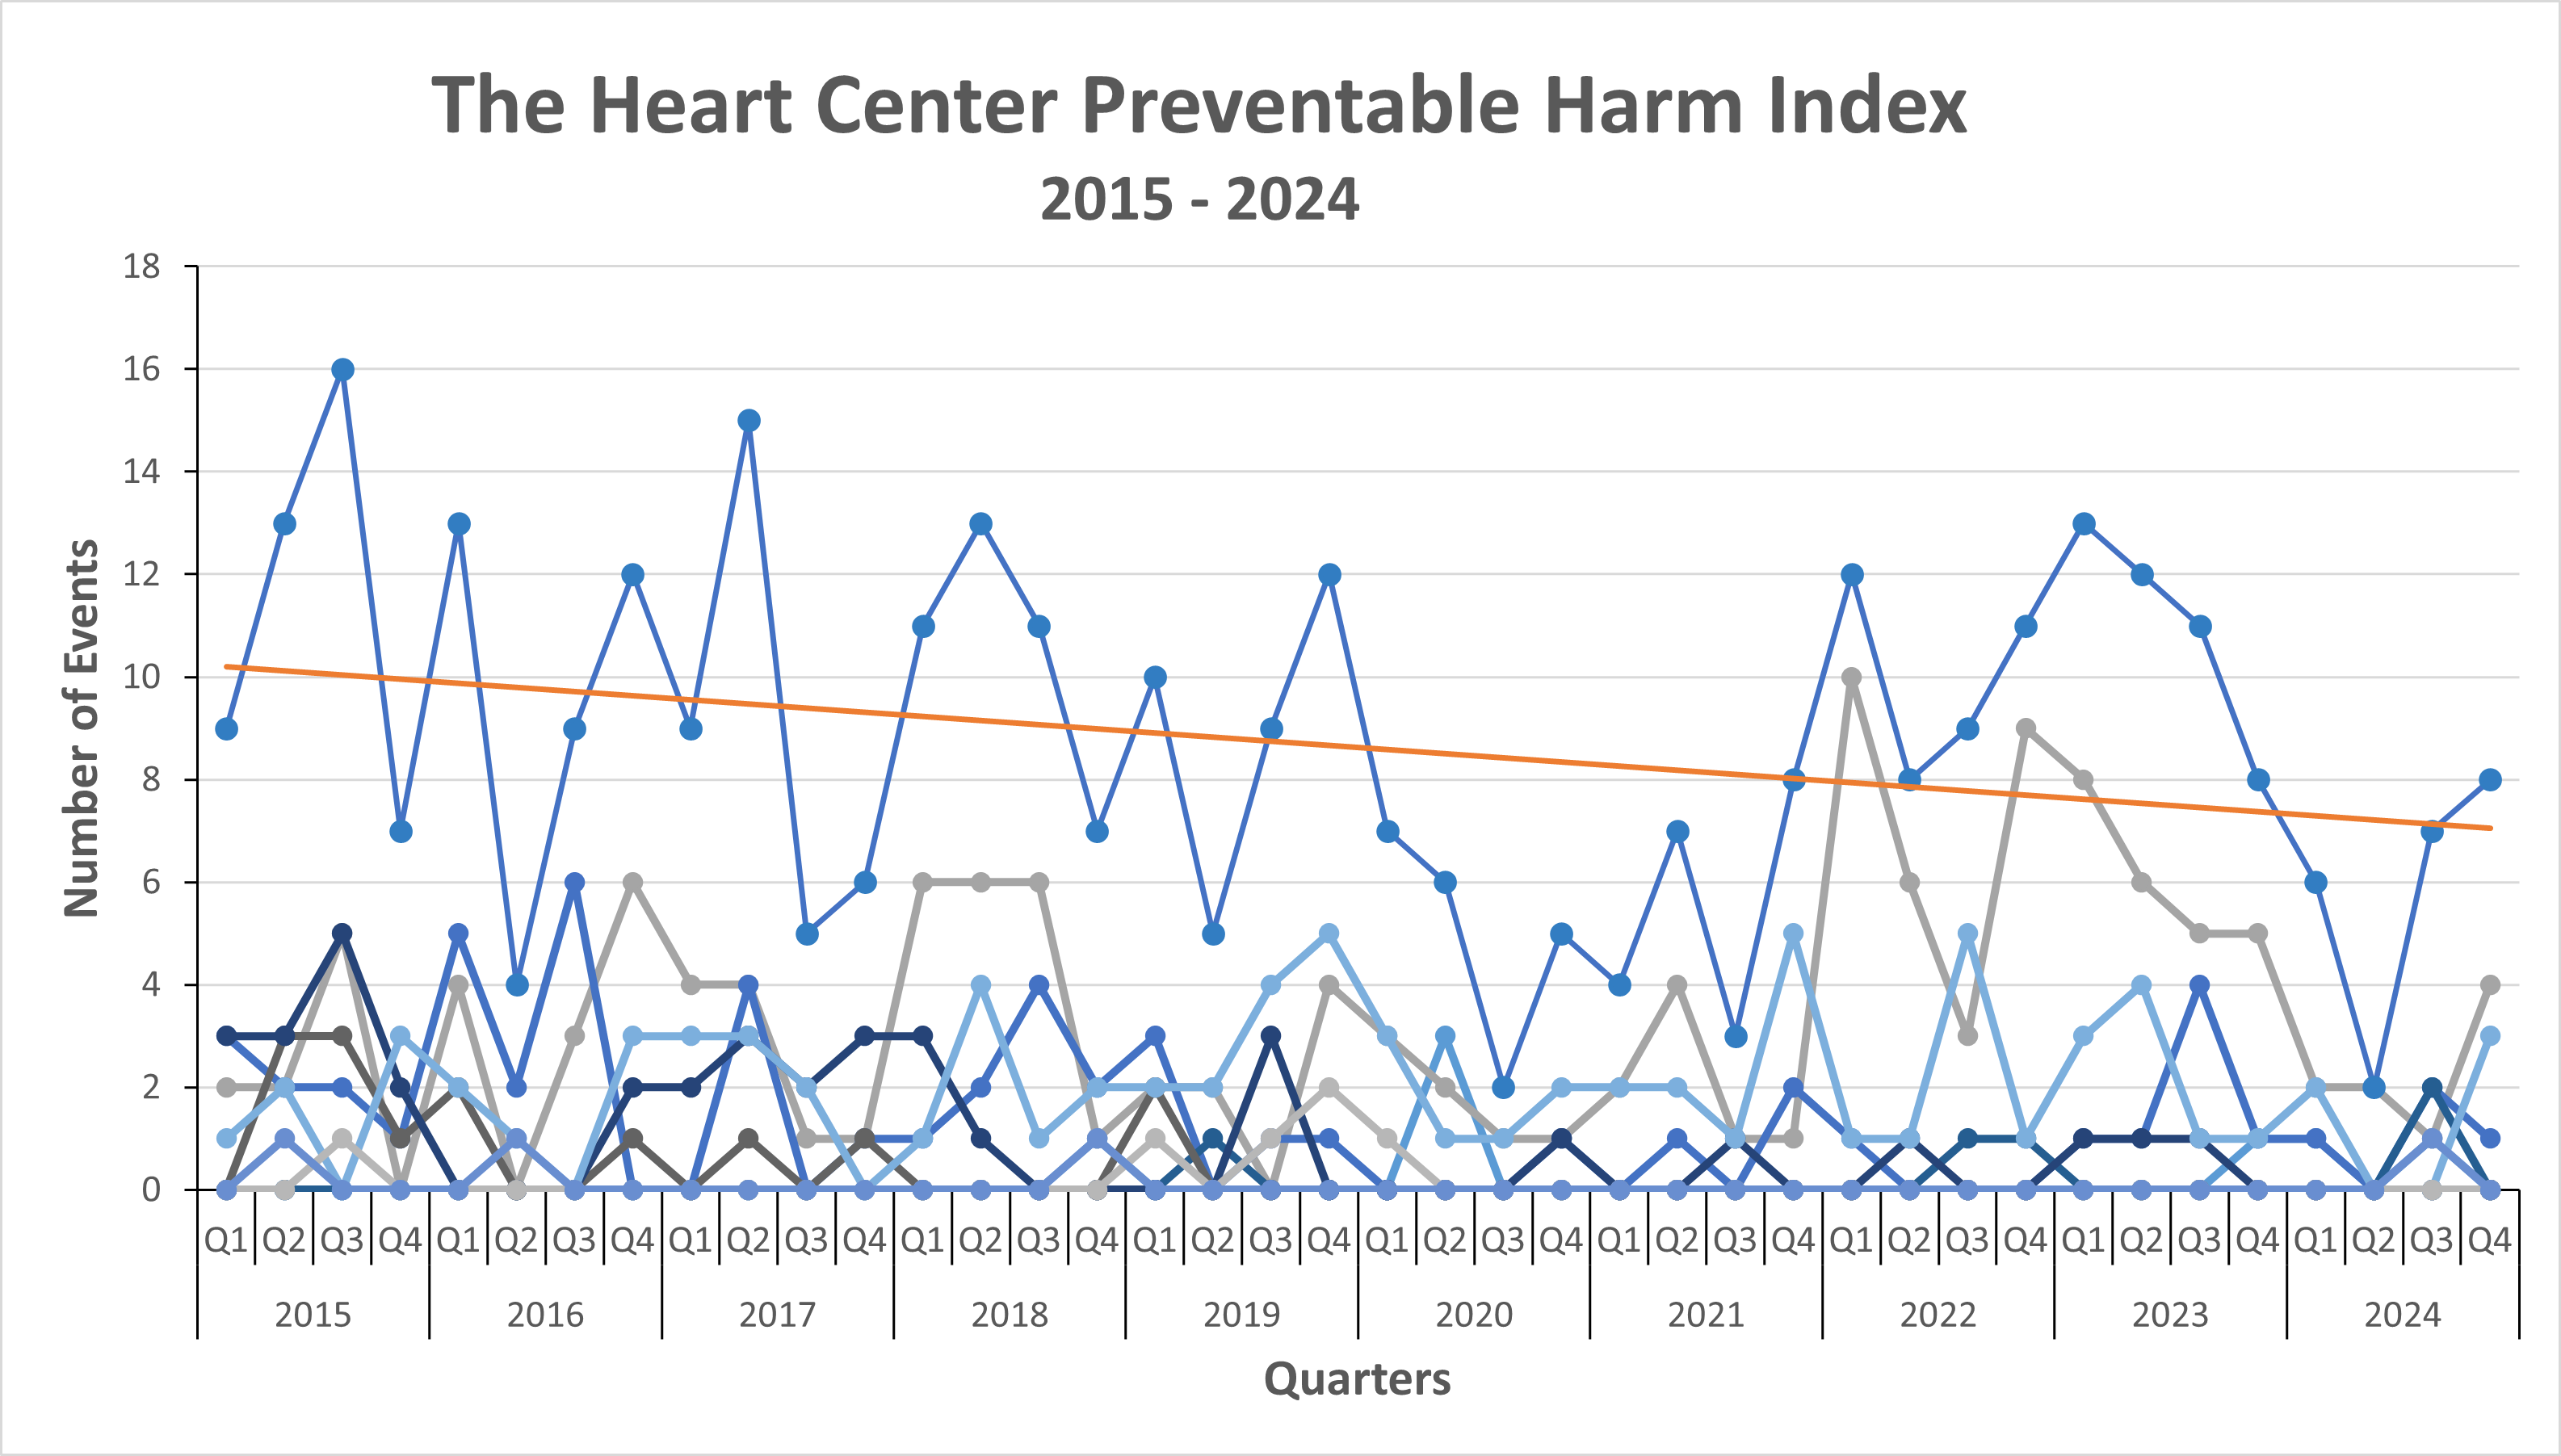
Safety
We are committed to the safety and care of every patient. Our goal is zero preventable harm. The idea of zero harm is achieved through many quality improvement measures and has led to us being a national leader with our “Zero Hero” program. As a hospital, we study measures around the prevention of medication errors, infections and hand hygiene.
With more than 35 ongoing projects to improve outcomes in heart care, we are always trying to better ourselves to provide the best possible care for our patients and their families.
The Preventable Harm Index below shows how we’ve decreased preventable harm from 2015 to 2023.
Concerns related to patient radiation exposure have led The Heart Center to create quality initiatives to reduce median radiation dosage during catheterization and electrophysiology (EP) procedures. As a result of the actions we’ve taken over the last few years, the year to date (YTD) median dose continues to decline.

You play an important role in your child’s health care. If you have questions about our outcomes at Nationwide Children’s, feel free to ask your child’s care team or contact us directly.