The Center for Clinical Excellence
Leading the Journey to Best Outcomes for Children Everywhere
The Center for Clinical Excellence
The Center for Clinical Excellence (CCE) is our “quality department.” However, it is so much more than a typical quality department. The CCE supports the carrying out of our strategic plan as it pertains to advancing clinical care aligned with Leading the Journey to Best Outcomes (results). Nationwide Children’s Hospital is a leader in advancing quality and safety through patient safety culture (our Zero Hero™ program), robust integrated quality improvement, One Team culture and innovation. This all results in providing the best patient care in the safest possible way.
Across Nationwide Children’s, we have adopted a transformative framework, called SCOPE, as our construct for how we think about quality and improving outcomes. This paradigm change challenges us to think much more broadly about “quality” and the role of a children’s hospital. Our unwavering commitment around safety and ending preventable harm remains, and our Zero Hero program now expands to focus on staff safety too. We have challenged clinical leaders to focus their quality efforts to define and improve clinical outcomes. After all, this is what is most important to patients and families. At Nationwide Children’s, we are uniquely committed to population health and health equity. Our work in these areas not only improves care for those within our health system, but, perhaps more importantly, addresses children who may never seek care. This is the future of health care playing out today! Finally, we are fully committed to optimizing the patient experience.
We invite you to explore our Center for Clinical Excellence webpage. To our patients, families and community, our goal is to share some of our efforts to improve child health as well as health care delivery across Nationwide Children’s. To health care professionals, we hope our webpage serves to help widen the lens of quality and challenges us to move further upstream to comprehensively address population health and equity. Working together, we can transform pediatric health and well-being.
Here are some ways we are Leading the Journey to Best Outcomes.
Zero Hero Safety at Nationwide Children's
Nationwide Children’s was the first pediatric hospital to declare a goal of zero preventable harm, a bold aim set in 2009 when the Zero Hero safety program launched. Over a decade later, the mission to pursue prevention, learn though excellence and events, and support our patients and staff is stronger than ever. Being a Zero Hero means that we Create a Safe Day. Everyday. Every time we start a shift.
Learn More About Our Safety Initiatives
What Is Zero Hero?
Zero Hero is the trademarked name of the Nationwide Children’s patient and staff safety program. Everything we do at Nationwide Children’s focuses on achieving the best outcomes for our patients, starting with safety. Quality and safety — both patient and employee safety — are core values. Experience our staff and patients describing what it means to be a Zero Hero.
Clinical Outcomes
Clinical outcomes are changes in health that can be both measured and followed. They go beyond simply providing safe care. They can take the form of many different aspects of health care. Clinical outcomes, however, should focus on what is important to the patient and their caregivers. Some examples of clinical outcomes include days with symptoms of illness, cancer freedom, quality of life or reduced days in the hospital. Other clinical outcomes could include preventive measures, such as vaccinations, or measures to maximize health, such as healthy weight management.
We have a team dedicated to improving clinical outcomes at Nationwide Children’s. The Clinical Outcomes Team in the Center for Clinical Excellence is comprised of four areas that exist to drive quality and standardization. These include the Quality Team, the Clinical Pathways Team, the Data Analytics Team, and oversight of Quality Education all focusing on best outcomes for our patients.
Quality Team members are experts in improvement science. They work closely with leaders in departments throughout the hospital driving our quality and safety strategic plan. Through facilitation of teams of leaders and frontline staff in various service lines in the hospital, they develop and advance projects aimed at improving clinical outcomes.
Our Clinical Pathways Team is responsible for leading and coordinating efforts around the design and implementation of pathways to treat specific patient populations and clinical diagnoses. Clinical Pathways support providers in decision making while concurrently reducing clinically unwarranted or unnecessary variation in practice in Nationwide Children's care delivery. Learn more about the Clinical Pathways at Nationwide Children's.
The Data Analytics Team specializes in clinical data and works closely with staff to provide data to track key metrics, make informed decisions about improvement opportunities and assure we are measuring outcomes appropriately.
Quality Education is an area of focus at Nationwide Children’s and includes options such as our Quality Leadership Academy and our Quality Improvement Publishing Program.
Population Health Quality Improvement Initiatives Seek to Improve Outcomes Among a Defined Population
Many of these projects are focused on a population defined by a specific diagnosis or a population who receive care at the same clinic. An example is the work Partners For Kids (PFK), the oldest and largest pediatric accountable care organization in the United States, does in south central, southeastern and west central Ohio. Partners For Kids is responsible for the care of more than 470,000 children covered by Medicaid Managed Care across 47 counties, partnering with more than 2,500 providers and supported by Nationwide Children’s and Dayton Children’s Hospital. PFK works to improve health outcomes for all children, focusing on quality initiatives around well visit and immunization compliance, lead screening, oral health, reproductive health and disease management work focusing on asthma and behavioral health.
Another component of work in this area is our Pediatric Vital Signs Initiative (PVS). PVS is the way we seek to measure and improve the health of children in the communities we serve, whether or not patients in that population receive care at Nationwide Children’s. It is a first of its kind effort in pediatric space.
 More About Pediatric Vital Signs
There are eight Pediatric Vital Signs that give us an indication of the health of children in a particular county in Ohio.
- Infant mortality
- Kindergarten readiness
- High school graduation
- Obesity
- Teenage pregnancy
- Suicide
- Child mortality
- Preventive care
Nationwide Children’s is collaborating with community partners in each of these key areas, using data as a guide to improve upon collective efforts.
Each Vital Sign is led by a group of subject matter experts who use quality improvement (QI) methodology to:
- Define and measure progress toward a long-term goal for improvement
- Implement evidence-based interventions shown to improve the outcome
- Track shorter-term, process measures to evaluate incremental progress
How Are We Working to Improve Health Equity?
The Robert Wood Johnson Foundation defines health equity: Health equity means that everyone has a fair and just opportunity to be as healthy as possible. This requires removing obstacles to health such as poverty, discrimination, and their consequences, including powerlessness and lack of access to good jobs with fair pay, quality education and housing, safe environments, and health care.
Nationwide Children’s vision is to create a “Health Equity Culture” with a goal of zero disparities in all quality, clinical, safety and service work conducted throughout Nationwide Children’s. For those we serve, a focus on health equity allows us to provide optimal care for all. We do this by applying a health equity and diversity lens to quality by gathering race, ethnicity, language and other pertinent demographic categories related to quality improvement projects. We then further analyze this information to see if there are possible disparities in the care we provide.
An Example of a Health Equity Initiative

Patient Experience at Nationwide Children's
Patient experience refers to the quality and value of all the interactions — direct and indirect, clinical and nonclinical — across the continuum of care. Patient experience can be tracked and measured many ways. One way that we measure patient experience is through patient satisfaction. To us, patient satisfaction means that we met the patient’s and/or family’s expectations. To collect and monitor patient satisfaction, we use Press Ganey and other survey tools. Additionally, we track patient experience outcome metrics throughout our hospital using various scorecards. Improvement initiatives related to these outcomes further enhance patient experience. Here are a few of the measures we utilize to track patient experience.
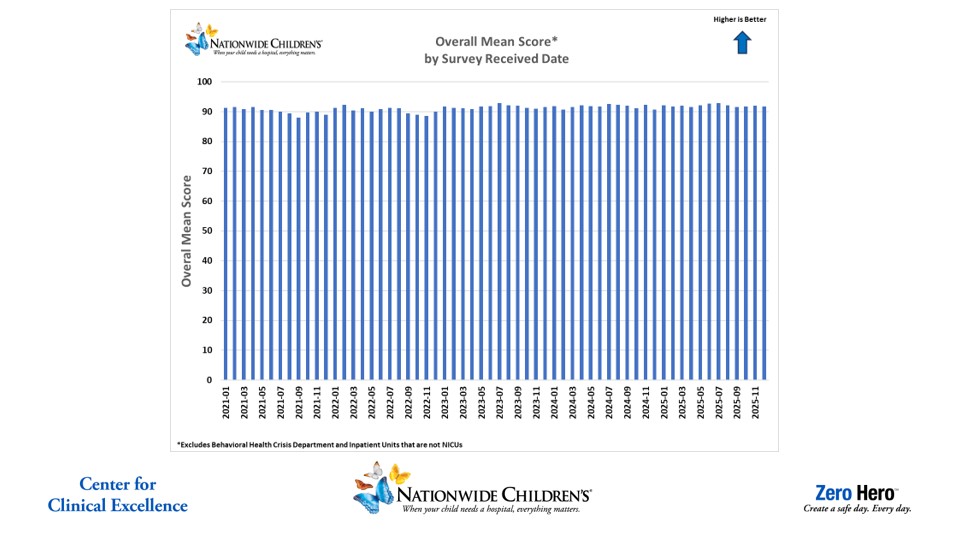
This chart shows Nationwide Children’s Overall Mean Score from Press Ganey surveys received from our patients and families. As shown, we consistently receive overall mean score near 90.
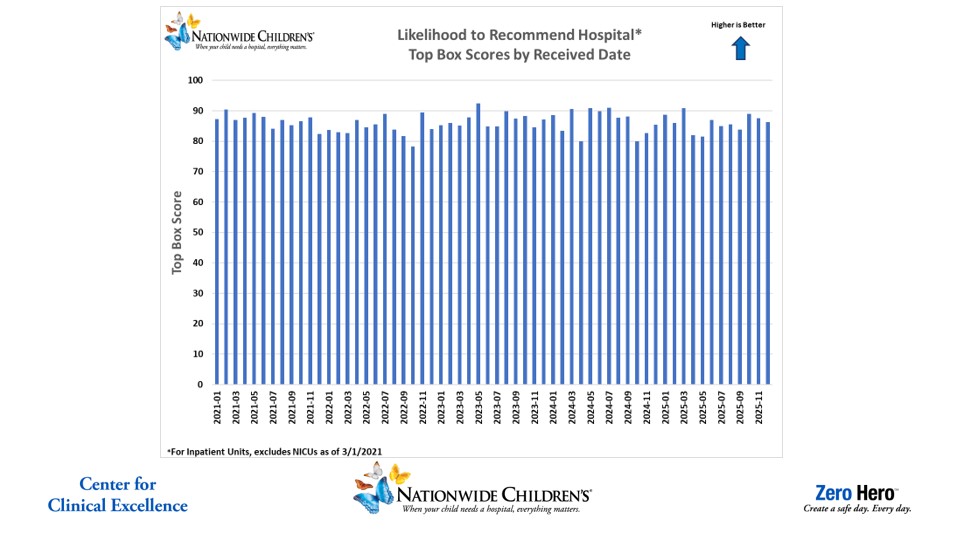
This chart shows the likelihood that our patients and families will recommend Nationwide Children’s to someone else. Over the past two years, we have received the highest score possible from about 85% of our patients and families.
Education Offerings
As nationally recognized leaders, Nationwide Children's Hospital celebrates many achievements within the Center for Clinical Excellence, one of them being our Quality Education offerings. After successfully training thousands of internal employees and external partners on QI science, we have expanded our opportunities to partner with and share our expertise with other organizations across the globe.
Here are our current educational opportunities: